CIS Managed Detection and Response™ (CIS MDR™) FAQ
CIS Managed Detection and Response™ (CIS MDR™) is available to U.S. State, Local, Tribal, and Territorial (SLTT) government entities. It deploys on endpoint devices to identify, detect, respond to, and remediate security incidents and alerts.
Overview
What is CIS Managed Detection and Response™ (CIS MDR™)?
CIS Managed Detection and Response™ (CIS MDR™) is a fully-managed and monitored solution deployed on endpoint devices to identify, detect, respond to, and remediate security events. This cost-effective service offers host-level protection and response backed by our 24x7x365 Security Operations Center (SOC) to strengthen an organization’s cybersecurity program, and it provides active defense against both known (signature-based) and unknown (behavioral-based) malicious activity. It consists of flexible solutions designed to meet your endpoint security needs, including commercial and GovCloud hosting options.
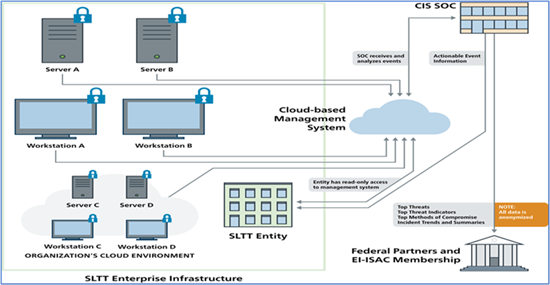
Organizations using CIS MDR benefit from the excellent response times and customer service of the 24x7x365 CIS SOC. Our SOC continuously monitors and manages CIS MDR software, which includes analyzing malicious activity for threats like zero-day attacks and escalating actionable events to the affected U.S. State, Local, Tribal, and Territorial (SLTT) organization. Upon identifying a threat event, this service can stop an attack in its tracks regardless of the network to which the endpoint is connected. As such, CIS MDR takes an active role in mitigating and remediating malicious activity affecting an organization’s devices by blocking malicious processes and quarantining malicious files or compromised endpoints.
What is included in the CIS Managed Detection and Response™ (CIS MDR™)?
CIS Managed Detection and Response™ (CIS MDR™) provides U.S. State, Local, Tribal, and Territorial (SLTT) organizations with a full-time cybersecurity defense partner through the excellent response times and customer service of the CIS Security Operations Center (SOC). The CIS SOC offers continuous monitoring and management, including analyzing malicious activity and escalating actionable events to the affected SLTT organization. The CIS SOC runs continuous operations 24x7x365 and is able to monitor SLTT endpoints even when an organization’s cybersecurity staff is not. The CIS SOC has one of the most complete data sets in the industry related to threats facing SLTT organizations, including zero-day attacks and other non-public known threats, so SLTTs using CIS MDR benefit from a service specifically tailored for them.
CIS MDR consists of flexible solutions and includes several capabilities that are installed into the endpoints as requested by the member. They are as follows:
- General
- Next Generation Antivirus (NGAV)
- Endpoint Detection & Response (EDR)
- USB Device Monitoring
- Host-Based Firewall Management
- Hosted in the GovCloud
- Asset Inventory
- Application Inventory
- User Account Monitoring
- Hosted in the Commercial Cloud
- Application Allowlisting and Blocklisting
- Advanced Ransomware Protection
- Data Loss Prevention
Additionally, CIS MDR provides access to a management portal that provides real-time view of detections triggered in your environment, information about sensors, and more data.
CrowdStrike and Sophos are CIS’s selected endpoint security partners for CIS MDR.
What is CIS MDR’s average alert response time?
CIS demonstrates world-class response times in addressing alerts, setting a performance benchmark that significantly outpaces commercial alternatives. Data indicates that CIS achieves an average response time of under 6 minutes—up to 5 times faster than commercial alternatives. This operational advantage highlights the strength of the “managed” component in CIS Managed Detection and Response. Our rapid response capability is not just a metric—it is a defining characteristic that underscores the superior efficacy of the CIS MDR solution compared to others in the industry. Quick threat detection alerts are crucial to minimizing the time attackers have to cause damage by containing threats before they spread. This rapid response can potentially reduce financial loss, operational disruption, and compliance risks for your organization.
Who is eligible for CIS CIS Managed Detection and Response™ (CIS MDR™)?
CIS Managed Detection and Response™ (CIS MDR™) is available to all U.S. State, Local, Tribal, and Territorial (SLTT) government members. Please contact us for pricing and more information.
Does CIS CIS Managed Detection and Response™ (CIS MDR™) replace any other CIS Services®?
CIS Managed Detection and Response™ (CIS MDR™) complements other security measures, including the CIS Critical Security Controls (CIS Controls), intrusion detection systems (IDS) like Albert, and Malicious Domain Blocking & Reporting (MDBR).
Adding CIS MDR to an organization’s defense-in-depth portfolio helps ensure a layered approach to cybersecurity while significantly increasing the time and complexity required for cyber threat actors (CTAs) to compromise their network.
Are the CIS Managed Detection and Response™ (CIS MDR™) Terms and Conditions available to be reviewed by our legal department prior to accepting them?
How do I purchase CIS Managed Detection and Response™ (CIS MDR™)
Please complete this form. A member of our team will reach out to you.
What do I need to do to get CIS Managed Detection and Response™ (CIS MDR™)?
Once you complete this form, a member of the CIS Services® team will reach out to you. The Services team will assist through the contract process. Once the contract is signed, you will receive an email requesting you to complete a Pre-Installation Questionnaire (PIQ) and Escalation Procedures.
How does onboarding for CIS Managed Detection and Response™ (CIS MDR™) work?
Once the contract is signed and you complete your Pre-Installation Questionnaire (PIQ) and Escalation Procedures, you will receive an email confirming that your account is setup. This email also includes step-by-step instructions on how to install sensors. Deployment set up calls are offered to further assist with the onboarding process.
What Operating Systems does CIS Managed Detection and Response™ (CIS MDR™) support?
The list of GovCloud-supported Operating Systems versions is available at https://www.crowdstrike.com/products/faq/ under the Deployment section. The list of Commercial Cloud-supported Operating Systems versions will be available at https://support.sophos.com/support/s/article/KBA-000002876?language=en_US.
If I currently have CrowdStrike or Sophos deployed on my devices, is there a migration process to move to CIS MDR?
- There is no direct migration process. You will need to uninstall the existing endpoint protection solution from your current account. Once your CIS MDR account is provisioned, you can install CIS MDR- supported agent on your hosts.
What steps should I take before uninstalling my current endpoint protection solution?
- Before uninstalling, ensure you have administrative access and disable any tamper protection features. Follow the official uninstall instructions provided by your current solution to avoid leaving residual components that could interfere with CIS MDR installation.
Can we send logs from other sources to CIS MDR?
- At this time, CIS MDR only supports endpoint telemetry managed through CrowdStrike or Sophos deployments. Log ingestion from other sources is not supported. We understand this may be a need for some organizations and are evaluating options for future enhancements.
Does CIS MDR support other endpoint protection products besides CrowdStrike and Sophos?
- Currently, CIS MDR supports only endpoint protection solutions hosted by CrowdStrike and Sophos. However, we are continuously assessing additional technologies and may expand our portfolio to include other solutions if they align with customer needs and security requirements.
How much does CIS Managed Detection and Response™ (CIS MDR™) cost?
Please contact us for pricing and more information.
Who do I contact if I have further questions?
Please contact us for more information.
MDR Spotlight: Add-on Module
What is CIS Managed Detection and Response™ (CIS MDR™) Spotlight?
CIS CIS Managed Detection and Response™ (CIS MDR™) Spotlight is an add-on, cost-effective module provided in partnership with CrowdStrike that allows for real-time, automated vulnerability assessment. It seamlessly integrates into the CIS/CrowdStrike MDR offering through a single scan-less, lightweight agent on the organization’s endpoints. This component serves up vulnerability data in seconds via intuitive, user-friendly dashboards, thus complementing your zero-day protection provided by CIS MDR.
Can the CIS Managed Detection and Response™ (CIS MDR™) Spotlight module be purchased on its own?
No, CIS Managed Detection and Response™ (CIS MDR™) Spotlight is a cost-effective add-on module to the CIS MDR solution provided in partnership with CrowdStrike.
If you are a new CIS MDR customer, CIS MDR Spotlight can be purchased along with the CIS MDR solution in partnership with CrowdStrike.
If you are an existing CIS MDR customer, CIS MDR Spotlight can be added to your CIS MDR solution account.
Can I purchase the CIS Managed Detection and Response™ (CIS MDR™) Spotlight module on only a portion of my endpoints?
No. When purchasing the CIS Managed Detection and Response™ (CIS MDR™) Spotlight module, it must be added to all endpoints. It cannot be segregated to only some endpoints on an account.
How do I sign up for the CIS Managed Detection and Response™ (CIS MDR™) Spotlight module?
Please complete this form. A member of our team will reach out to you.
How much does the CIS Managed Detection and Response™ (CIS MDR™) Spotlight add-on service cost?
Please contact us for pricing and more information.
Who do I contact if I have further questions?
Please contact us for more information.
MDR Mobile: Add-on or Standalone Module
What is CIS Managed Detection and Response™ (CIS MDR™) Mobile?
Provided in partnership with CrowdStrike, CIS Managed Detection and Response™ (CIS MDR™) Mobile enables you to gain visibility into blind spots in threat detection on supported Android and iOS devices in real time, provides actionable insights on mobile threats, and mitigates cyber risk to mobile devices through automated threat protection — all with a privacy-centric design. MDR Mobile is a robust endpoint detection and response (EDR) solution tailored for mobile devices that is exclusively available to U.S. State, Local, Tribal, and Territorial (SLTT) government organizations through CIS and powered by CrowdStrike.
What is included in the CIS Managed Detection and Response™ (CIS MDR™) Mobile service?
Powered by CrowdStrike, CIS Managed Detection and Response™ (CIS MDR™) Mobile provides continuous real-time monitoring on your iOS and Android devices. MDR Mobile equips security teams with automated threat protection through endpoint detection and response (EDR) that blocks malicious phishing links, identifies vulnerable devices, protects against zero-day attacks, and detects malicious and unwanted activity on business-critical mobile apps. This functionality facilitates rapid response to phishing attempts, leaky apps, insider threats, and more, thus protecting both device health and corporate data. With near-zero effect on battery life and bandwidth usage of the device, MDR Mobile deploys easily in a high-performance lightweight app, all without compromising user privacy.
Who is eligible for CIS Managed Detection and Response™ (CIS MDR™) Mobile?
CIS Managed Detection and Response™ (CIS MDR™) Mobile is available to all U.S. State, Local, Tribal, and Territorial (SLTT) government members. Please contact us for pricing and more information.
Can the CIS Managed Detection and Response™ (CIS MDR™) Mobile module be purchased on its own?
Yes, CIS Managed Detection and Response™ (CIS MDR™) Mobile is offered as an optional add-on or as a standalone feature in partnership with CrowdStrike. If you are a new CIS MDR customer, MDR Mobile can be purchased along with the CIS MDR Core solution powered by CrowdStrike. If you are an existing CIS MDR Core customer, MDR Mobile can be added to your CIS MDR Core account.
How do I purchase CIS Managed Detection and Response™ (CIS MDR™) Mobile?
Please complete this form. A member of our team will reach out to you.
What do I need to do to get CIS Managed Detection and Response™ (CIS MDR™) Mobile?
Once you complete the form, a member of our CIS Services® team will reach out to you. The CIS Services team will assist you through the contract process. Once the contract is signed, you will receive an email asking you to complete a Pre-Installation Questionnaire (PIQ).
How does onboarding for CIS Managed Detection and Response™ (CIS MDR™) Mobile work?
Once the contract is signed and you complete your Pre-Installation Questionnaire (PIQ), you will receive an email confirming that your account is set up. This email will also include step-by-step instructions on how to install the application to mobile devices using the Mobile Device Management (MDM) of your choice. Deployment setup calls are offered to further assist you with the onboarding process.
What Operating Systems does CIS Managed Detection and Response™ (CIS MDR™) Mobile support?
CIS Managed Detection and Response™ (CIS MDR™) Mobile supports iOS 15 and later as well as Android 9.0 and later.
What Mobile Device Management platforms does CIS Managed Detection and Response™ (CIS MDR™) Mobile support?
CIS Managed Detection and Response™ (CIS MDR™) Mobile leverages flexible architecture and is available on both iOS and Android platforms, providing a hassle-free integration process with pre-existing mobile device management (MDM) platforms. MDR Mobile is currently available for devices managed with Workspace ONE (formerly Airwatch), Jamf, and Microsoft Intune Endpoint Manager (formerly Intune); compatibility with additional MDMs is on the product roadmap.
How much does the CIS Managed Detection and Response™ (CIS MDR™) Mobile module cost?
Please contact us for pricing and more information.
Who do I contact if I have further questions?
Please contact us for more information.
MDR Multi-Tenancy: Add-on Feature
What is CIS Managed Detection and Response™ (CIS MDR™) Multi-tenancy?
CIS Managed Detection and Response™ (CIS MDR™) Multi-tenancy is an add-on feature geared toward organizations that oversee numerous subordinate organizations.
- Organizations set up in the CrowdStrike Falcon Platform with parent accounts will have access to see the endpoint security activity of each subordinate organization.
- Subordinate organizations will only be able to see their own endpoint security activity under MDR Multi-tenancy.
How do I purchase CIS Managed Detection and Response™ (CIS MDR™) Multi-tenancy?
Please complete this form. A member of our team will reach out to you.
How much does CIS Managed Detection and Response™ (CIS MDR™) Multi-tenancy cost?
There is an upfront, one-time onboarding fee. Please contact us for pricing and more information.
What do I need to do to get CIS Managed Detection and Response™ (CIS MDR™) Multi-tenancy?
Once you complete the form, a member of our CIS Services® team will reach out to you. The CIS Services team will assist you through the contact process. Once the contract is signed, you will receive an email asking you to complete a Pre-Installation Questionnaire.
Can I have multiple Parent accounts?
Our data structure can only support one parent account.
I have a significant number of sub-organizations under my own. Can these organizations have their own access and filters up to me?
Yes, each sub-organization can be given access to their own organization. You can customize roles, permissions, and escalation procedures in whatever way you find most effective for the organizations under your purview.
Is there a limit on the number of subordinate organizations under the Multi-tenancy structure?
No, CIS Managed Detection and Response™ (CIS MDR™) Multi-tenancy does not have a limit on the number of subordinate organizations.
Can I purchase CIS Managed Detection and Response™ (CIS MDR™) Multi-tenancy on its own?
No, CIS Managed Detection and Response™ (CIS MDR™) Multi-tenancy can only be purchased as an add-on configuration to the CIS MDR solution.
- If you are a new CIS MDR customer, MDR Multi-tenancy can be purchased along with the CIS MDR Core solution provided in partnership with CrowdStrike.
- If you are an existing CIS MDR customer, MDR Multi-tenancy can be added to your CIS MDR Core account. Sensors in the existing MDR account can be migrated to the new MDR Multi-tenancy structure.
What are Parent accounts able to do?
Parent accounts provide escalation procedures customization including:
- Defining escalation contact call order and notification contacts for the parent account and subordinate organizations.
- Defining whether subordinate organizations contacts get access to the CrowdStrike Falcon platform.
- Defining whether subordinate organizations contacts are added to notifications.
How does onboarding for CIS Managed Detection and Response™ (CIS MDR™) Multi-tenancy work?
Once the contract is signed and you complete your Pre-Installation Questionnaire (PIQ), you will receive an email confirming that your account is set up. This email will also include step-by-step instructions on how to install new sensors or migrate existing hosts to the new subordinate organizations. Deployment setup calls are offered to further assist you with the onboarding process.
Can hosts be migrated from existing accounts to new subordinate organizations?
Yes, if hosts are linked to your CIS Managed Detection and Response™ (CIS MDR™) Core account, hosts can be migrated from existing accounts to new subordinate organizations if the sensor versions are supported for host migration. If your hosts are not in an account managed by CIS, please contact us for more information.
How can sensors be migrated from existing accounts to new subordinate organizations?
Once the contract is signed and you complete your Pre-Installation Questionnaire (PIQ), you will receive an email confirming that your account is set up. This email will also include step-by-step instructions on how to migrate existing hosts to the new subordinate organizations.
What sensor versions are supported for host migration?
CIS Managed Detection and Response™ (CIS MDR™) Multi-tenancy supports Windows 7.17 and newer as well as Mac/Linux 7.16 and newer.
